May 3, 2021 Update
▼CLICK ON THE INTERACTIVE CHART TO VIEW DATA▼
DAT DRY VAN
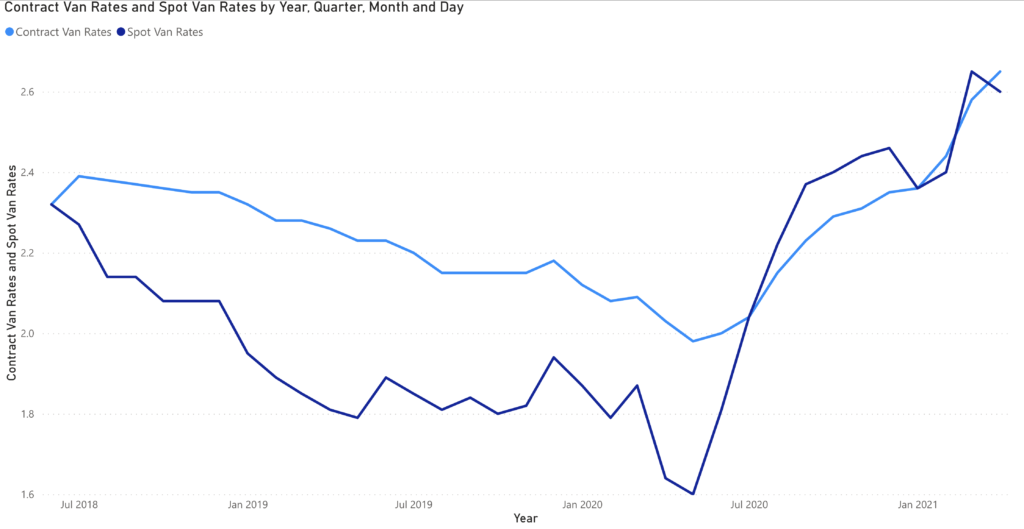
While using 2020 as the basis for any comparison should be viewed cautiously, today’s rates are significantly higher than the rates we saw during the “Shipper Armageddon” period of spring/summer, 2018.
The short/medium term outlook does not indicate any relief in sight as the demand for freight capacity is expected to remain high. The consumer portion of the economy remains hot as retailers rebuild inventories, stimulus checks are cashed and consumer confidence, now at a 13-month high, are working in concert to drive high demand for freight services.
Additionally, the industrial sector is showing signs of life, as global economies come back on-line.
Given the highly favorable environment for carriers, the obvious move is for asset-based carriers to increase capacity, but that remains difficult.
COVID concerns certainly led to a significant number of drivers retiring or moving to other vocations, but the Federal Drug and Alcohol Clearing House, which went on-line in January 2020 has removed approximately 60,000 drivers from the available pool with about 40,000 of those drivers removed for marijuana use. State laws legalizing medical and recreational use of marijuana are in conflict with federal laws, and the threat of losing one’s job due to a positive test may suppress applicants from coming into the industry.
Carriers are fighting for qualified drivers by offering significant increases to driver compensation programs.
For our larger shipper clients, the most concerning aspect of the situation we are seeing is the impact on contract rates. A significant number of truck drivers have been removed, voluntarily or involuntarily, from the pool, and while we are seeing a record number of new carriers being established, they are primarily very small operators. This is leading to double-digit increases in contract rates and tender decline rates have exceeded 25% for the past couple of months.
DIESEL
WEST TEXAS CRUDE
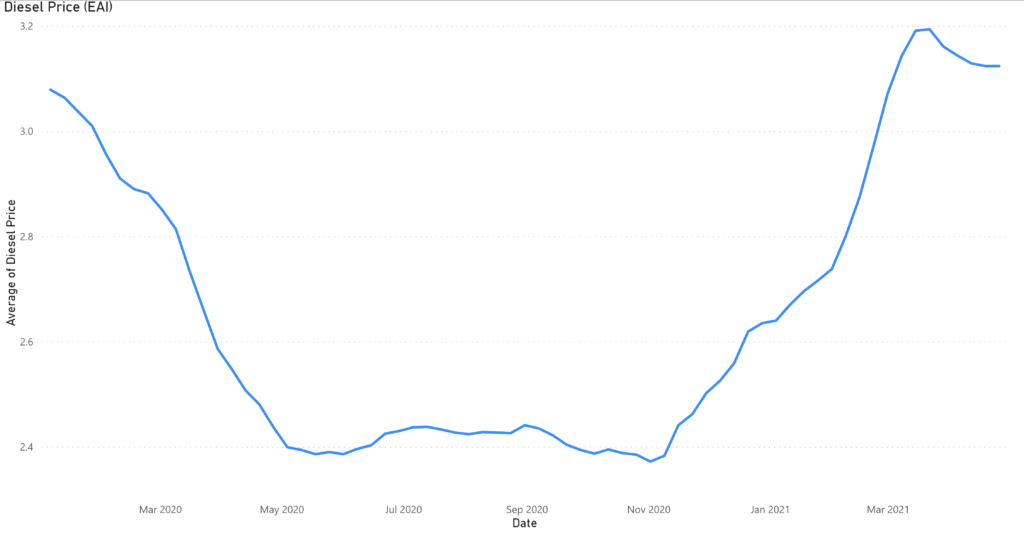
WTI is now at $63.50 / barrel, and we are re-approaching the highs of March, when WTI crude exceeded $66 / barrel. As the world gets back to business this spring/summer, “expert” opinion is for oil to hit and exceed $70 / barrel, which will keep national diesel prices in the $3.00 - $3.50 / gallon range. However, oil prices are notoriously difficult to predict given its susceptibility to a range of unpredictable economic and geo-political factors.
OCEAN CONTAINER RATES (Asia to US)
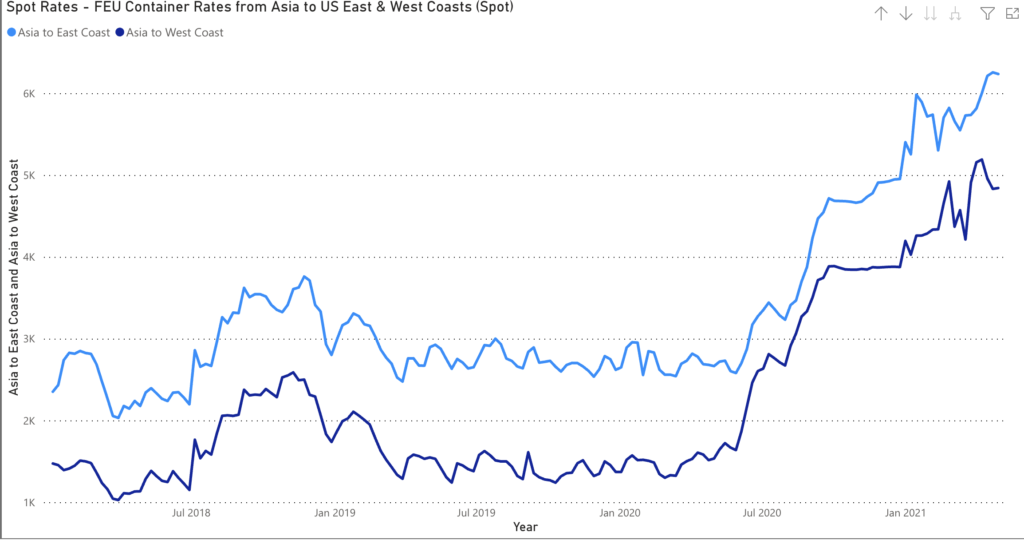
Even for those shippers willing and able to pay these rates, other challenges arise. The surge of container volumes has increased the number of rolled loads. Port congestion is increasing both the variability and average time required to import products. The Ever Given fiasco added fuel to the fire by blocking a key artery in the global container circulatory system, thereby exacerbating the container shortage. As congestion gets worse at certain key ports, full containers are being dumped at wrong (but less congested) ports so that empties can be brought back to Asia for re-loading at the exorbitant rates we are seeing today.
This is even impacting the ability of US exporters to ship products, as the extra time required to load & offload a full Asian-bound container is less financially attractive to the steamship lines than simply shipping back empty containers so they can be reused more quickly on the more profitable trade lanes. While horrible for North American importers and exporters alike, the steamship lines are reaping the benefits through both higher volumes and revenue / container.
In the short-term, this will be highly profitable, but one must wonder how these behaviors will be viewed both by the BCO community, as well as by governmental regulatory authorities.
Finally, while this chart focuses on the spot market, we are also seeing significant increases in contract rates. Xeneta, a provider of ocean contract information, has estimated that contract rate increases are up 23% since December, 2020. However, there is a significant and growing delta between the largest container importers (e.g. Walmart, Target, Home Depot, Lowes, Amazon) and smaller BCOs, which will serve to further enhance the already sizable pricing power seen by the mega-retailers.
sources referenced in this post: Freightos, US Energy Information Administration, DAT, Freightwaves, Xeneta, and WTI
About the Author
Mike Mulqueen is the Executive Principal of Strategy & Innovation at JBF Consulting. Mike is a leading expert in logistics solutions with over 30 years managing, designing and implementing freight transport technology. His functional expertise is in Multi-modal Transportation Management, Supply Chain Visibility, and Transportation Modeling. Mike earned his master’s degree in engineering and logistics from MIT and BS in business and marketing from University of Maryland.
About JBF Consulting
Since 2003, we’ve been helping shippers of all sizes and across many industries select, implement and squeeze as much value as possible out of their logistics systems. We speak your language — not consultant-speak – and we get to know you. Our leadership team has over 100 years of logistics and TMS implementation experience. Because we operate in a niche — we’re not all things to all people — our team members have a very specialized skill set: logistics operations experience + transportation technology + communication and problem-solving skills + a bunch of other cool stuff.


