In this 2-Part series, JBF Consulting explores the impact of excessive loading times on shippers and carriers and the benefits of addressing this issue.
Here, we look at detention from a truckload (TL) carrier’s perspective, specifically in terms of the financial impact.
In Part 2, we will examine the issue from a shipper’s perspective, highlighting why the issue persists and what shippers can do to address excessive detention in their Distribution Center (DC) and yard operations.
Overview
- Distribution Center operations that result in excessive loading/unloading times are a drag on carrier revenue and profitability
- The financial mechanism used by carriers to penalize shippers (i.e. detention charges) does not recover the totality of revenue lost by carriers
- Carriers respond to excessive detention with both higher rates and increased tender rejections
- In over-the-road truckload (TL) transportation, the buyer/seller relationship strongly favors the buyer due to the fragmented and commoditized nature of freight transport. Carriers that raise their rates are easily replaced with lower cost carriers
- The inability of shippers to quantify the financial impact of detention leads to inaction
- This inaction leads to higher freight costs for individual shippers and the shipping community as a whole
Part 1 – The Impact of Dwell Time on Truckload Carriers
What is Trucking Detention
For the purpose of this article, detention (a.k.a. dwell) is the excess time a carrier spends at a facility performing all the necessary activities required to execute a pickup or delivery.
This paper is focused on detention associated with long-haul TL transportation, as detention is not a significant issue for LTL or parcel carriers.
Moreover, the factors that go into ocean and rail detention/demurrage are quite different and are not covered.
Carrier Revenue and Detention
In TL transportation, carriers are primarily compensated based on the mileage between the origin and destination of a load. Additional fees (ex. fuel surcharges, stop-off charges, re-positioning fees) may be applied, but the primary revenue driver for a carrier is loaded miles.
The time that the carrier spends making a pickup or delivery is uncompensated until a contractual threshold is exceeded. At that point, the carrier may be able to claim a detention fee. The threshold wait time before detention fees are applied is typically 2 hours. Hourly fees range from $25 to $100. However, carriers report that collecting detention fees is onerous and often not worth pursuing. Consequently, the hourly detention fees collected by carriers are significantly less than the cost incurred.
Even when detention fees are collected, the time spent hauling cargo drives significantly more revenue for a carrier than sitting in a shipper’s yard. Figure 1 highlights this difference. Considering the following using typical industry averages.
- An hour of driving generates $100 of revenue (assuming an average speed of 50 mph at $2.00 / mile)
- Waiting time at a DC generates $0 dollars for the first 2 hours and $75 / horr for the third hour (assuming typical detention terms and fees)
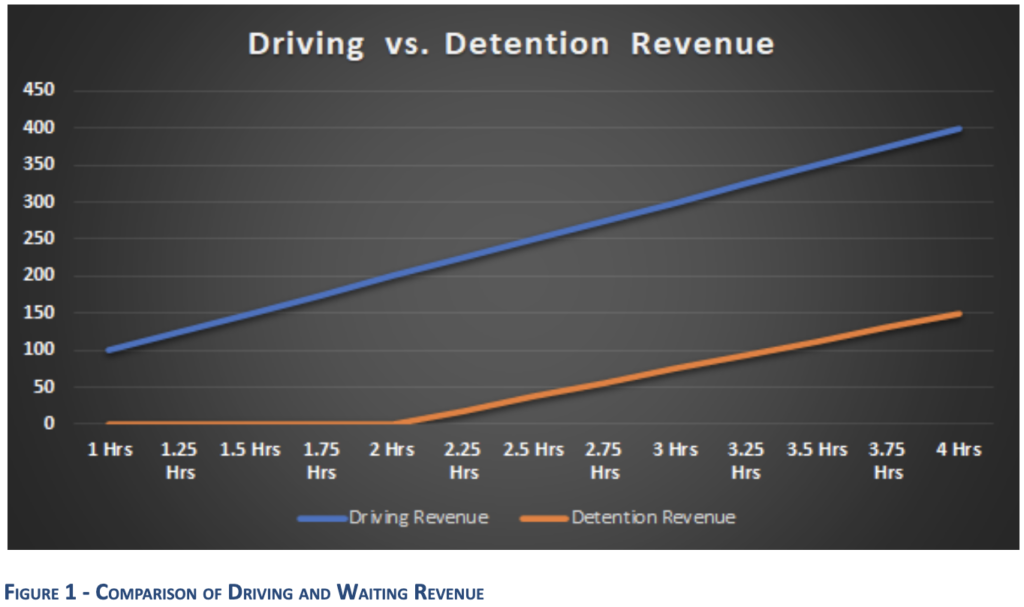
This simple example explains why carriers are eager to reduce loading/unloading time while also providing a glimpse into why shippers view things differently.
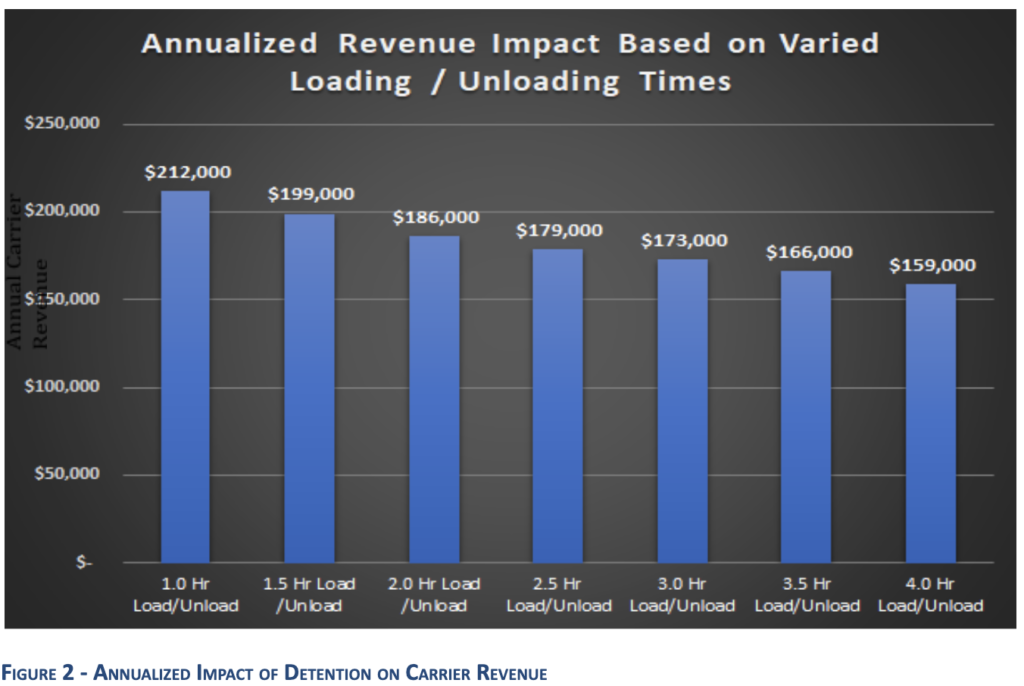
Figure 2 shows the impact of detention on a carrier’s annual revenue for a single driver/asset combination. As the average detention time increases (X-axis), the number of revenue-generating miles decreases. While detention fees capture some of the lost revenue, they do not capture the totality of the loss.
To maintain profitability, the carrier can either increase its rates or stop doing business with the offending shipper/receiver. However, if they choose to increase their rates, the probability of maintaining a business relationship with the shipper decreases.
Figure 3 shows the impact to a carrier’s rates. In our model, the objective is to generate $200,000 in annual carrier revenue for a single driver/power unit combination.
Carriers must charge higher rates to maintain revenue as dwell times rise. After 2 hours, the increase slows due to the capture of detention revenue, but the rates still rise, indicating that when using industry-standard rates and fees, detention revenue does not accumulate as fast as driving revenue. Put another way, driving is more productive than waiting.
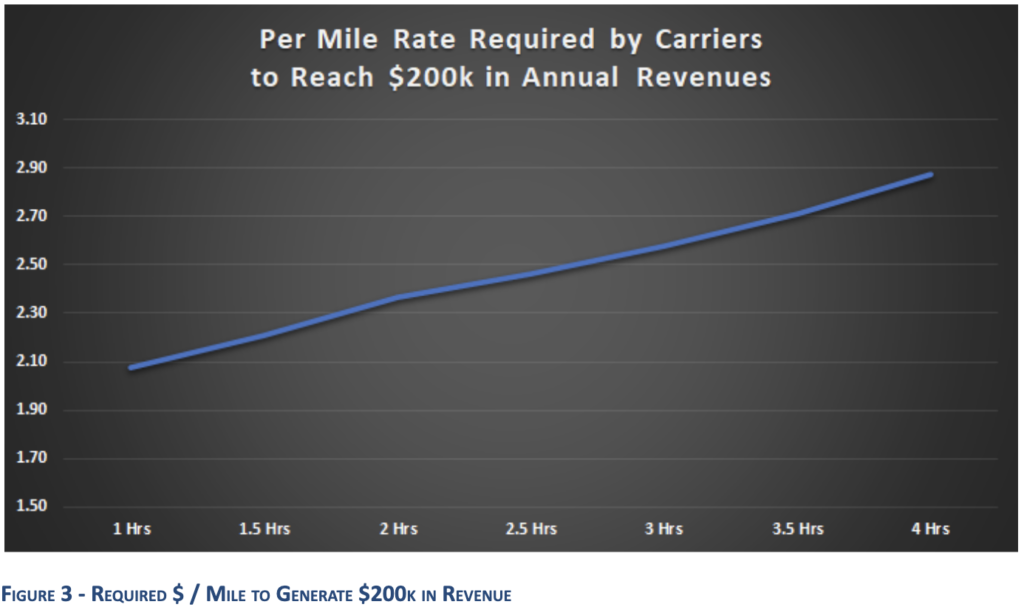
The implication is that the impact of detention on a carrier’s top line is significant. If, for instance, a carrier decreases their average pickup and delivery times from 3 to 2 hours, they could lower their rates by $0.21 / mile and generate the same annual revenue by utilizing their assets more efficiently. A portion of these savings could then be passed on to shippers in the form of lower contract or spot rates.
A Manufacturing Analogy
For a moment, think of a TL carrier as a manufacturer, whereby the “units produced” are the carrier’s loaded miles. The pickup and delivery process can be viewed as machine downtime, or “change-overs.”
When optimizing manufacturing processes, the objective is to maximize the number of units produced over time. Part of this strategy is to minimize change-over times. The same concept applies to trucking.
We want to “produce” the maximum number of loaded miles and minimize detention (i.e. change-overs), which negatively impacts vehicle productivity. Put simply, we want to get the carrier in and out of the DC as quickly as possible.
Another similarity to manufacturing is the trend toward smaller lot-sizes. In a manufacturing environment, we see the concept of SKU proliferation reducing lot sizes. In long-haul trucking, the average dry van length of haul has dropped 37% over the last 20 years, according to a 2018 ATRI study (see Figure 4).
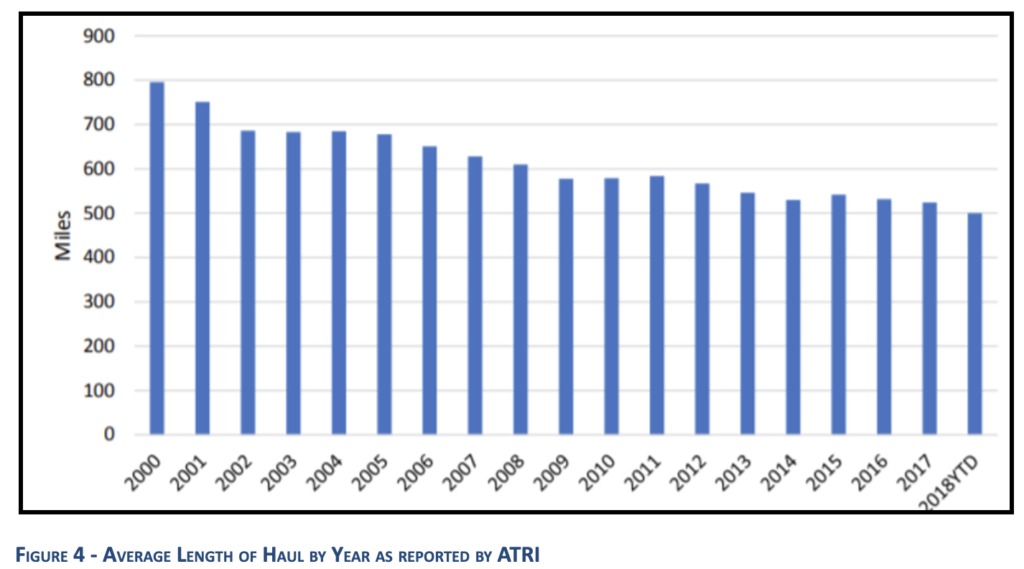
Instead of 800 revenue-generating miles per load, as there was in 2000, shipments in 2018 were only averaging 500 mi. This means that in order to maintain the same level of revenue, carriers must haul more loads and consequently subject to more “production” downtime/changeovers.
Figure 5 demonstrates the effect this has on a TL operator. Assume a carrier drives 100,000 miles / year and 13% of those miles are empty, non-paid miles. If the average length of haul is 500 miles, the carrier will need to haul 174 loads (87,000/500).
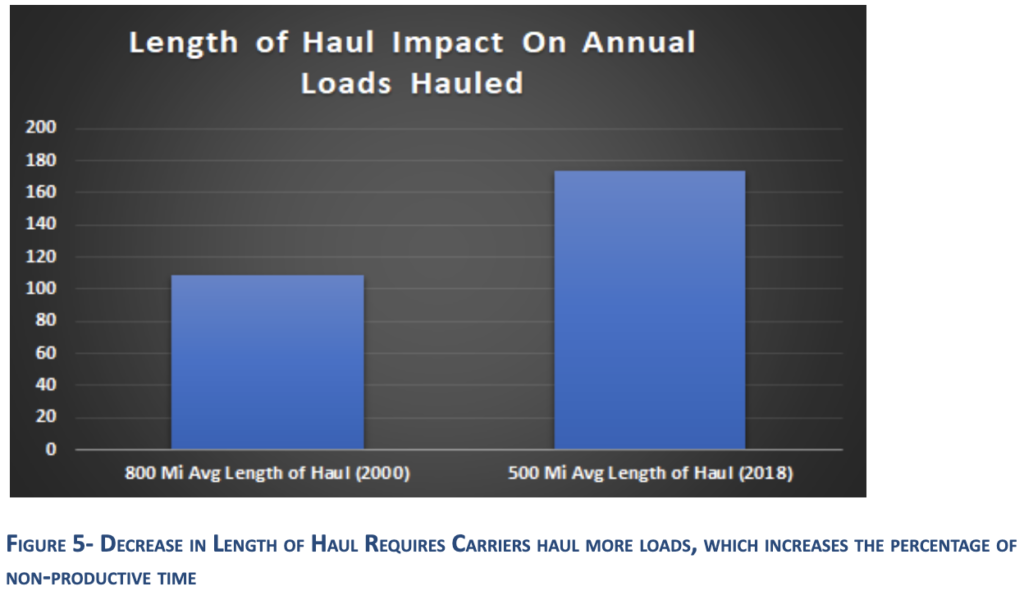
However, if the average length of haul is 800 miles, as it was in 2000, the carrier would need to haul only 109 loads (87,000/800). Assuming an average load/unloading time of 2 hours for each pickup and delivery, the carrier will now spend an additional ~520 hours per year on non-revenue, unpaid activities compared to 2000.
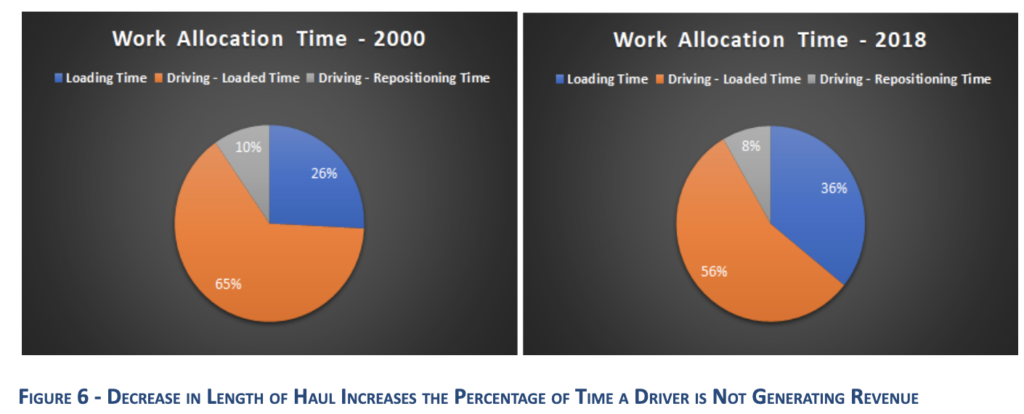
Figure 6 further highlights the change in drivers’ work allocation since 2000. When the average length of haul was 800 miles, 26% of a driver’s year would be spent getting loaded or unloaded. In 2018, that number increased to 36%, given the assumptions laid out above.
Summary
For carriers, excessive detention is a significant hindrance to profitability.
For many shippers, however, detention is not a significant cost item and therefore, not a top-of-mind issue worthy of addressing. Shippers that look at detention in this manner may be costing their organizations significantly more than they believe.
When pricing out a long-term contract or a spot quote, carriers consider the total cost of servicing a shipper and will apply premiums for those customers that negatively impact their bottom line. While detention fees may be a rounding error for many large shippers, I would urge them to consider the premiums they may be paying through higher contract rates, higher tender rejection percentages, and an increased reliance on the spot market.
In Part 2, we will discuss detention from a shipper’s perspective. We will identify both the explicit and implicit costs of excessive dwell time and what shippers can do to address the issue. Read it here.
For an assessment and more information as to how JBF Consulting can assist you with your transportation and logistics needs, please email us at info@jbf-consulting.com.
Appendix
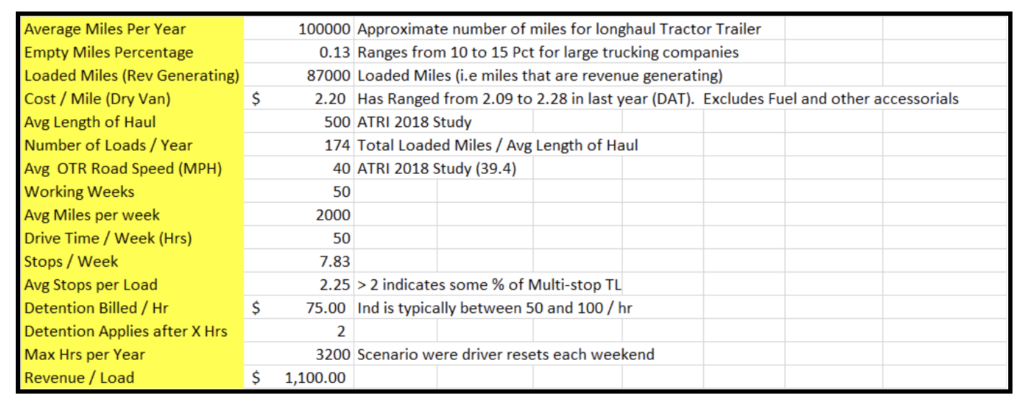
Assumptions and variables used in the Detention Impact Model
Additional Resources
ATRI Operational Costs of Trucking 2018
OOIDA 2019 Detention Time Survey
Uber Freight 2020 Facility Insights Report
About the Author
Mike Mulqueen is the Executive Principal of Strategy & Innovation at JBF Consulting. Mike is a leading expert in logistics solutions with over 30 years managing, designing and implementing freight transport technology. His functional expertise is in Multi-modal Transportation Management, Supply Chain Visibility, and Transportation Modeling. Mike earned his master’s degree in engineering and logistics from MIT and BS in business and marketing from University of Maryland.
About JBF Consulting
Since 2003, we’ve been helping shippers of all sizes and across many industries select, implement and squeeze as much value as possible out of their logistics systems. We speak your language — not consultant-speak – and we get to know you. Our leadership team has over 100 years of logistics and TMS implementation experience. Because we operate in a niche — we’re not all things to all people — our team members have a very specialized skill set: logistics operations experience + transportation technology + communication and problem-solving skills + a bunch of other cool stuff.